News
4
minutes reading time
2 Mar 2026
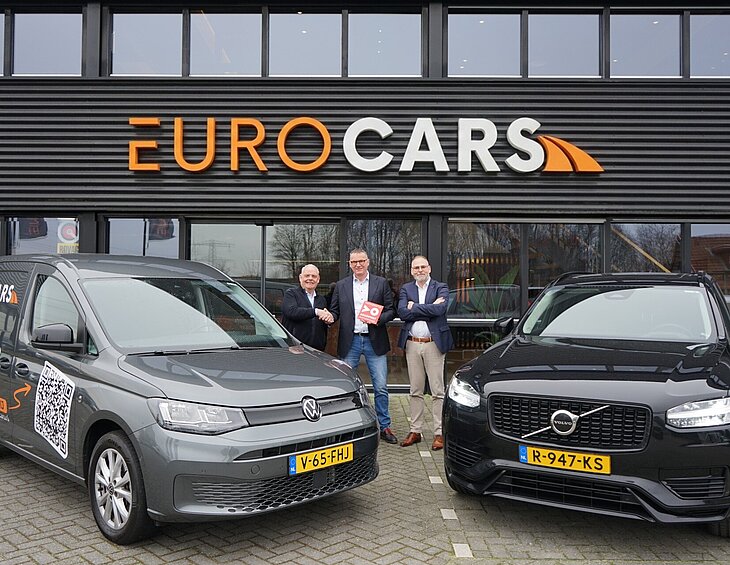
Eurocars strengthens Brainport network with partnership
Eurocars Mobility joins the Brainport Partnerfonds, actively contributing to future-proof mobility and strong regional cooperation in Brabant.

![[Translate to English:]](/fileadmin/_processed_/7/e/csm_regio-coordinatoren-Beethoven-op-loopbrug_februari_2026_b669113236.jpg "[Translate to English:]")


![[Translate to English:]](/fileadmin/_processed_/8/e/csm_Robidus_Partnerfonds_214eff6352.jpg "[Translate to English:]")
![[Translate to English:]](/fileadmin/_processed_/3/5/csm_BvE_interview_Yuverta_100ste_lid_b56c491c7d.jpg "[Translate to English:]")
![[Translate to English:]](/fileadmin/_processed_/f/4/csm_Vebego-partnerfonds-2-2_bc48f65eba.jpg "[Translate to English:]")


![[Translate to English:]](/fileadmin/_processed_/f/9/csm_MedTech_Groeiplan__2025-1_a2283cfe71.jpg "[Translate to English:]")